
IT language of Data Analysts
Report, dashboard, ID, trends, tracking — what does it all mean and what is Simo's solution? Data analyst Denis Davydov and Web analyst Anton Patsai shared with the Anywhere Club blog the words, expressions, and jokes that they encounter every day. Engage fully in the professional context if you are curious about how to get into data science.
What kind of analytics is there

Denis started off the discussion:
— Analytics is an area that is located between IT (directly development) and the client (business customer). I have been doing analytics for a long time and previously, it was more focused on analyzing the presentation of data — visualization, plotting, and diagrams. This is all still part of analytics now, but it has become easier since various frameworks have appeared that do all of this quickly and simply. On the other hand, there is more data engineering in the analyst's work today.
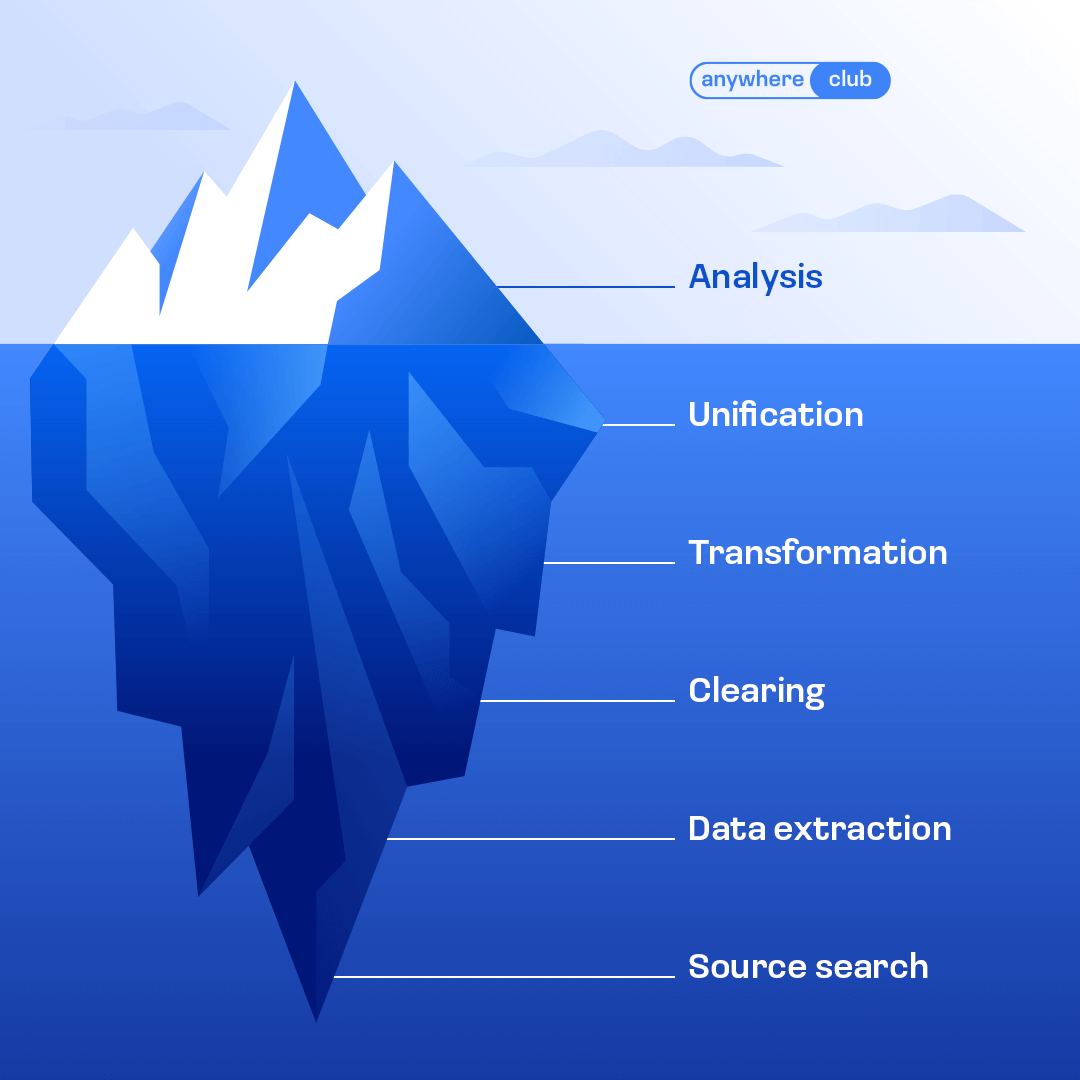
You often see analytics drawn like an iceberg: 20% are above water (the visible numbers and graphs that the analyst built) and 80% are below the water (invisible work done on finding the source, pulling data, processing the data, clearing "garbage," and configuring logic). Now, in my work, 90% of it is the underwater part that the user does not see.
Anton picks up here:
— I must say that I am a web analyst, and Denis is a classic data analyst. There is a slight difference. I'm more focused on setting up tracking on websites and working with tools that allow you to track the site. The word “track” is a web analytics classic. Tracking means watching, monitoring user actions, collecting data about something systematically. I set up tracking systems that, like sensors, trigger different user actions and send information about them to databases, from which either I or data analysts are building reports. The data analyst collects this data into a database and visualizes it from the database in tools such as Power BI or Tableau, so that it can be viewed. Briefly, my task is to obtain the data necessary to create reports, and Denis has to build these reports.
.png)
Analytics slang in IT
Denis adds the following:
— The slang of analytics in IT very much depends on the specifics and frameworks that analysts work with. We are working with Google analytics on a project, so concepts from Google analytics are being pulled up accordingly. Someone who works with other sources will have their own slang defined by the source. Analysts can work in different frameworks and programs, using different terms accordingly.
But there are some common terms that all analysts need to know, including:
- A “report” is the final product of any analyst. They can be created using Data Studio, Power BI, etc. But there is a specific form or kind of report known as a dashboard.
- A “dashboard” is a visualization of data for a client (customer) so that the client can use it to find some insights on user behavior or on the operation of the platform. When you're flying an airplane, you don't have time to study what a particular indicator means. You need to be able to take a quick look and understand if everything is in order. If something is wrong, then you can look more closely and decide what to do. The idea of the dashboard is that it provides a snapshot. Every piece of information that is critical should be on the screen so you can see and understand it in an instant: the main sensors, some light bulbs that burn red and green, some arrows. If a sensor blinks, you realize that you are running out of fuel. It tells you that there are so many kilometers to the nearest airfield, and there is so much fuel in reserve. Conclusion — it is necessary to set the plane down in an open field. Or, an example from the IT world: a conditional project manager looks at the dashboard and sees that the number of users on the site has dropped sharply. So, something went wrong. They delve more deeply into reports and look at why the number has decreased: where users came from, what could affect their outflow, whether something has broken. Analytics helps to understand the essence of the problem.
- “ID” refers to identifiers. If the analyst counts people, then these are the ID tags of people; if places, then these are locations. We do not work with specific names of people: instead, there are identifiers that accurately identify people or location, country, city. If we are talking about web analytics, then we are referring to the identification of the user's cookies; their browser. For example, a browser visited our site. The data passed through the provider of a particular country. So, we understand that this is a user from that country. In fact, this is a browser that had the IP of that country. In reality, it could be 10 different users who used the same computer and a VPN, while they were in another location. These are assumptions that you have to work with.
Anton follows that by explaining:
— If super-accuracy is required from a data analyst, then trends are more likely from a web analyst. It's enough for our purposes that we see a trend; for example, that we have a decrease in users or an increase in a certain percentage.
Denis points out:
— But there are tasks in analytics where accuracy is needed. Inventory is one example. If 1000 cars arrived at the warehouse, it would be strange if 500 were sold, 300 remained, and the whereabouts of the remaining 200 is unclear. But there is not always such accuracy in analytics. The analyst is working on mathematical statistics, and statistics are about probabilities. There are assumptions made when working with large numbers. We need to see a trend. In fact, in most cases, it does not matter to a business whether 500 or 503 new users arrived yesterday. Instead, they need to understand: is the business growing or are there negative trends taking place? We work with trends most often.
Anton offers another example of slang:
— Recently, I had to deal with something, and I wrote in a chat with colleagues: "I'm trying to set up a custom client ID here for a GTMa prod of a customer. The one where dataLayer = globalDataLayer. I use the solution from Simo (template GTAG GET API). It is clear that it does not work because of the variable name. Changed the dataLayer code to globalDataLayer. And issued permits. But there is still no push. What to do?" It is not at all clear to an unenlightened person what this is about. First, as in other areas of IT, analysts often use Anglicisms, and second, these Anglicisms are often written in Russian letters, then in English, and then mixed up. And that's fine. And third, there are a lot of abbreviations in analytics. Here are some of them:
- GA — Google Analytics;
- GTM — Google Tag Manager;
- dataLayer — data area;
- Simo (Simo Ahava) — the name of a web analytics icon. He was a pioneer in many technical issues of web analytics, in particular working with Gum and Google Analytics. He has his own Blog, which many analysts follow. Analysts often use some decisions that he made as guidance, or incorporate his decisions into their own;
- DQ (data quality) — work on data quality, eliminating anything unnecessary. This is something that usually takes a very long time for an analyst;
- DS (data studio) — Google visualization tool; and
- DWH (Data Warehouse) — a database made specifically for analytics and business processes.
Humor for you
Denis concludes with some humor:
— Before I came to analytics, these jokes seemed to me monotonous and too straightforward. But then I began to understand them. They all come down to one of two types:
- When the client does not understand the full degree of complexity of receiving and converting data. For example, an analyst is asked to provide some figure by the morning. The requestor is very surprised when the analyst says that it will take a week of work. As an analyst, sometimes your task requires you to look at something, so you go to look at the table, and there you find that the data is in the wrong format. And the data need to be connected to another table. A “simple” task sometimes takes weeks or months.
- When analysts are ready to build data for a long time, work in complex systems, such as Power BI, and the business instead asks them to simply upload everything to an Excel file. And the analyst cries at these words.
.png)
It takes a lot of time to prepare data and build reports. But it takes no less time to communicate with the client: to understand what they ultimately want, and what needs to be displayed on the dashboard, in what form, and for what period of time. Sometimes, the client knows exactly what kind of analytics they need, and other times we get requests like: "show us how things are going," "I want to see what our problems are," or "I need to take a look and be able to decide what to do next." As a result, one of the most common jokes about both an analyst and any IT worker is this one:
.png)
You can learn more about the skills needed to become a data scientist and read about career transition to data science and career path to data scientist.

.png?auto=webp)
