
How can the HEART framework help you understand and measure a product's success?
In this article, you will learn about a framework called HEART, which was created by Google.
The author of this article is digital marketer Anna Orestova.

Some time ago, I worked for a startup. We were creating a mobile app and we had to answer questions such as:
- Do the users understand how to use this app?
- Could the app help them solve their problems?
- Are they happy with the results?
- Will they return again or will they stop using it?
I looked for a simple framework that could help us: choose the right metrics, group metrics with similar parameters, and provide ideas about how to measure the quality of user experience. I found the HEART framework and created my matrix. Below, I explain how it works.
What does HEART stand for?
HEART is an acronym. The letters in its name stand for five categories: Happiness, Engagement, Adoption, Retention, and Task Success.
- Happiness describes the attitude toward the product. Are users satisfied with it and would they recommend it? Is the product easy to use?
- Engagement refers to the level of interest and involvement with the product. What is the number of visits per user per week/month? How many interactions with the product per user per day/week?
- Adoption reflects how many users start to use a product for the first time, and how many users install a new version of the app within a certain time. Has using the product become a habit for users? How many people become regular users?
- Retention describes how many users from a given period came back to using your product at a later time. What percentage of users are returning users?
- Task Success refers to the success of completing main tasks with the help of your product. What percentage of users have been able to solve their problems? What’s the error rate?
What are the goals, signals, and metrics for HEART?
Let’s consider the Goals, Signals, and Metrics for each of these 5 categories.
- Goals help us to identify the purpose of the product or feature, especially in terms of user experience.
- Signals will help us to understand if users are achieving their goals or not. Here, you should pay attention to the feelings and actions of your customers.
- Metrics will help you to transform signals into value. Metrics should measure the signals and indicate success or failure.
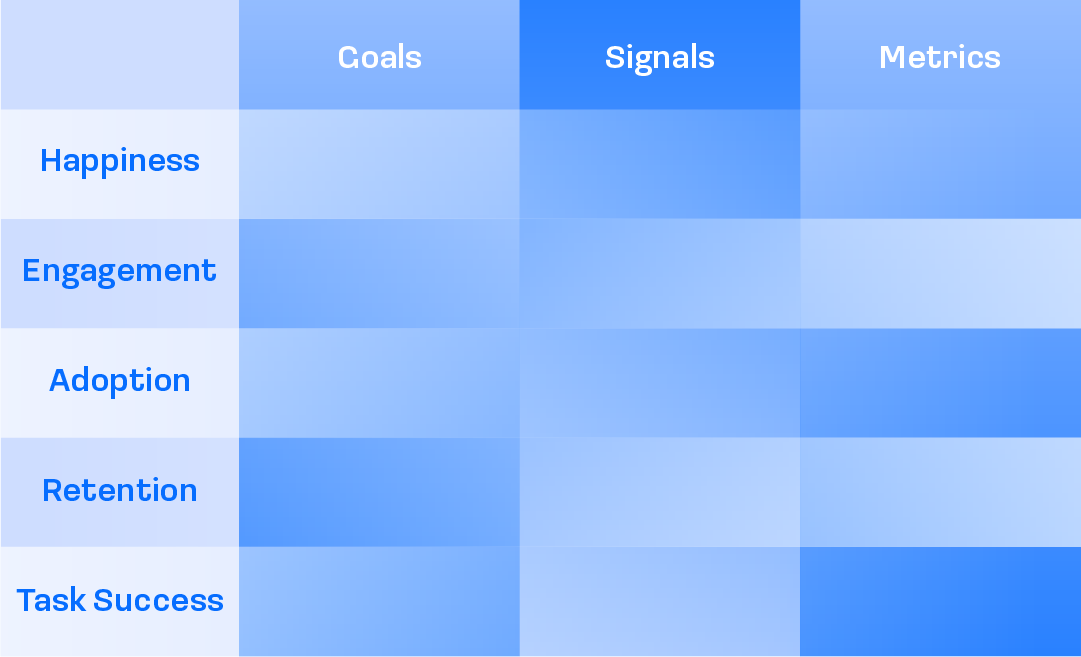
Our goal is to fill out the table below with the necessary data.
Happiness
The goal of this category is to increase the number of people who feel satisfied after using your product. Ideally, you will create a “wow” effect for your customers and increase the number of them.
Possible signals can be positive feedback from users about using your product, their recommendation of the product to their friends, or a 5-star rating.
The metrics are Rating for the app, and the Customer satisfaction metrics (NPS, CSAT, CES).
Engagement
The goal of this category is to encourage users to use the product. Perhaps the goal is to increase the time that users spend using your product in a day for example.
Possible signals can be that people spend more time using your product, they open your emails, and they write comments on social media.
The metrics are Average Duration of Sessions, Average Session Frequency, Depth of Usage, Open Rate, Active Users, Social Activity and Time Spent.
Adoption
This category focuses on increasing the number of people who use your product regularly. For example, increasing the number of people who install the updates.
Possible signals can be that users register an account and start using pay functions.
The metrics are New Users, Activations Rate, Conversion Rate, Purchase Rate, Average Order Value.
Retention
The goal of this category is to increase the number of people who continue using your product, making repeat purchases.
Possible signals can be users making repeat purchases or using features many times.
The metrics are Сustomer Retention Rate, Customer Lifetime Value, Average Revenue per Customer, Churn Rate, Repeat Purchase Rate.
Task success
The goal of this category is to increase the number of people who solve their problems with the help of your product in a defined period of time.
Possible signals can be users completing tasks or leaving the tasks unfinished or the app making mistakes. For example, users buy successfully or abandon the cart and don't complete the purchase.
The metrics are Task Success Rate, the Average Time to Complete a Task, Error Rate, Failure Rate, ANR (App Not Responding).
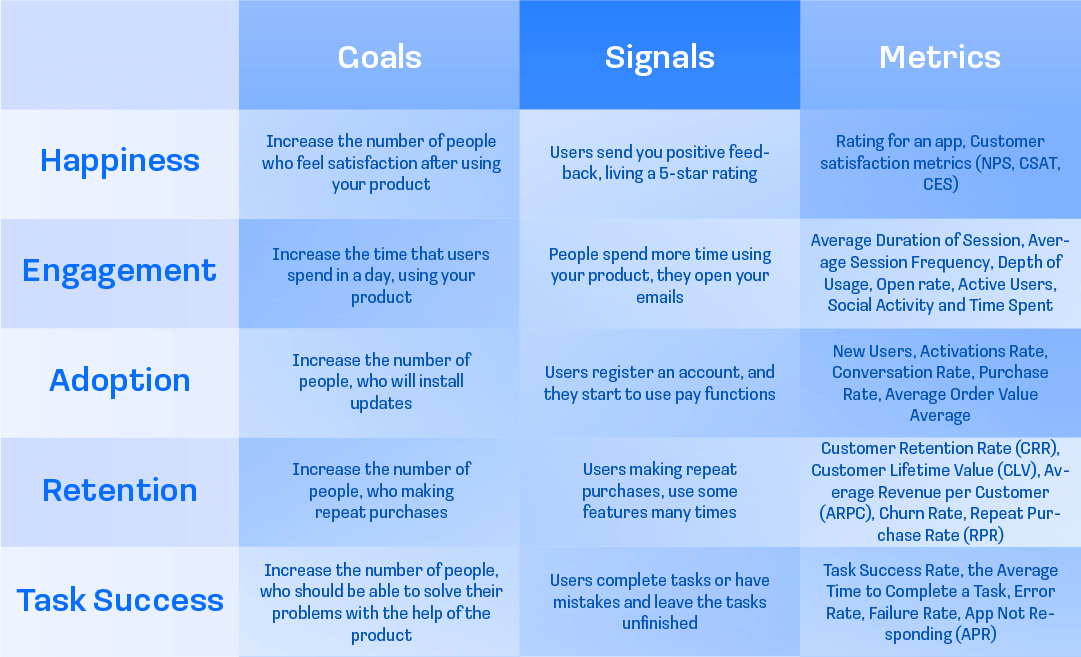
Final matrix
When the graphs are filled in, you should have a table like the one below. Keep in mind that you don’t have to use all the categories. Choose the ones that are necessary for your project. If you start A/B tests and want to know which version of the product is more effective and results in fewer error rates, you can focus on only one category — Task Success — and fill out Goals, Signals and Metrics for it.
What is the next step?
When the table is ready, you should discuss it with the team. Sometimes, members have different thoughts about the categories, goals, and signals. It's very important to agree on a common vision.
After that, you should understand how you can obtain these metrics: what information you can collect with the help of analytic platforms and what information your back-end developer can give to you.
Do you use the framework HEART?
As I mentioned in the beginning of this article, we used this framework for a startup. I created the table, we discussed it with the team, received data, analyzed it, and made some improvements to our product. This method worked for our team. What about you? Do you use HEART in your work?
Let’s discuss it in our Discord channel.

.png?auto=webp)
