
What Are Observability and Monitoring? Concepts, Benefits, and Tools
The author of this article is EPAM Solution Architect Rahul Mujnani.

Introduction
We are in an era of rapid digital transformation, in which businesses are adapting to diverse technology stacks and constructing software solutions that rely on cloud, on-prem, hybrid, and distributed systems to address their specific business requirements.
These solutions resolve complex business issues while simultaneously presenting new challenges related to system architecture, performance, scalability, complexity, security, resilience, and the maintainability of the systems. Consequently, it is essential for businesses to precisely monitor the application, network, storage, and infrastructure layers of their systems. It is crucial to recognize that minutes or hours of system downtime can have a significant impact on business revenue, and on users’ trust.
To effectively understand contextual indicators and control the state of their systems, engineering teams must focus on monitoring and observability:
- Monitoring helps engineering teams to pinpoint WHEN an issue arises within the systems.
- Observability delivers insights into WHY the problem occurred.
Let's consider both concepts in more detail.
What is monitoring?
The continuous observation of a system for the purpose of detecting and notifying of any abnormal behavior is known as monitoring. Monitoring focuses on watching specific metrics that relate to business objectives, and taking appropriate actions when certain thresholds are reached.
Examples of monitoring metrics can be CPU usage, memory utilization, traffic at peak load, response latencies, or error rates on services.
Monitoring has changed in recent years. Traditional monitoring is no longer sufficient to permit businesses to gather actionable insights on their software systems. Modern systems can have multiples states. They might be powered by dozens of microservices, composed of distributed systems, and they might be cloud native, hybrid, and multi-cloud applications.
Engineering teams need to have mechanisms to pinpoint how the behavior of a particular service may impact a product’s behavior and its cascading effect on the user experience.
What is observability?
Observability is concerned with understanding the state of the system by analyzing logs, metrics, and traces. It aids in analyzing what is happening in each context across the system to predict future states and generate actionable data. Observability provides detailed insights into the behavior of the system and a richer context, enabling a comprehensive understanding of how it behaves from the inside out.
Implementing observability makes it easier to recognize early indications of potential issues. The objective is to maintain control and address problems before they have a widespread impact on the system. The higher the level of observability of a system, the more effectively engineering teams can comprehend the system’s state and address potential problems. This becomes especially critical when striving to meet service level indicators (SLIs) and service level objectives (SLOs).
While the terms monitoring and observability are similar and often used interchangeably, they have distinct characteristics, particularly in the context of hybrid cloud and multi-cloud systems. However, it should be noted that observability cannot be effectively leveraged without the presence of monitoring — monitoring is essential for achieving observability.
Monitoring can notify teams when a problem arises, but it may not assist in resolving the underlying issue. This is where observability comes to the rescue by identifying the root cause of the problem.
Benefits of observability and monitoring
1. Informed decisions: With the implementation of observability, engineering teams can gain a deeper understanding of their software systems and make informed decisions regarding system performance, security, system architecture, and infrastructure enhancements. This offers significant advantages by uncovering hidden issues and identifying bottlenecks within the software systems.
2. Operational awareness and collaboration: Observability promotes a culture of operational awareness, enabling organizations to bring together various streams of information to assess system performance, identify areas of potential leakage, determine causes of potential failures, and implement preventive measures before potential issues can impact overall product performance or availability. This paradigm shift often leads to cultural transformation within organizations, as teams adopt a proactive and data-driven approach, fostering a continuous improvement mindset.
3. System performance and capacity: With the implementation of robust observability and monitoring systems, organizations can achieve comprehensive visibility across their entire infrastructure, encompassing on-premises and cloud-native environments. This empowers organizations to meticulously monitor the health and performance of hosts, services, and containers, while also offering the ability to create customized metrics and triggers alerts in alignment with the organization’s specific SLOs. Moreover, this approach facilitates efficient cost control for companies that have adopted elastic infrastructure.
4. Streamlined troubleshooting process: Observability significantly speeds up the process of troubleshooting issues, enabling engineering teams to conduct root cause analyses with accuracy. Accessing contextual information and pinpointing the exact source of a problem allows teams to discern why an issue occurred and take swift action to mitigate its impact.
5. Automated feedback: Harnessing the power of observability, engineering teams can gather valuable feedback on newly released code from production environments. This expedites the iterative development process, facilitating prompt improvements and enhancing overall engineering productivity.
6. Early incident detection and automated alerts: Embracing a comprehensive approach to observability and monitoring plays a pivotal role in improving business performance and enhancing user experiences. Proactively detecting issues at an early stage through automated alerts enables organizations to swiftly initiate appropriate measures to prevent widespread service degradation. Teams can also define thresholds and alert conditions, ensuring timely notifications when breaches occur.
7. Monitoring external integrations: In today's digital landscape, systems rely on third-party services, APIs, and cloud providers. Observability and monitoring extend their scope to encompass these vital dependencies, empowering teams to meticulously assess the performance and reliability of external services. This proactive approach enables organizations to plan and carry out necessary actions whenever issues arise.
Observability and monitoring concepts
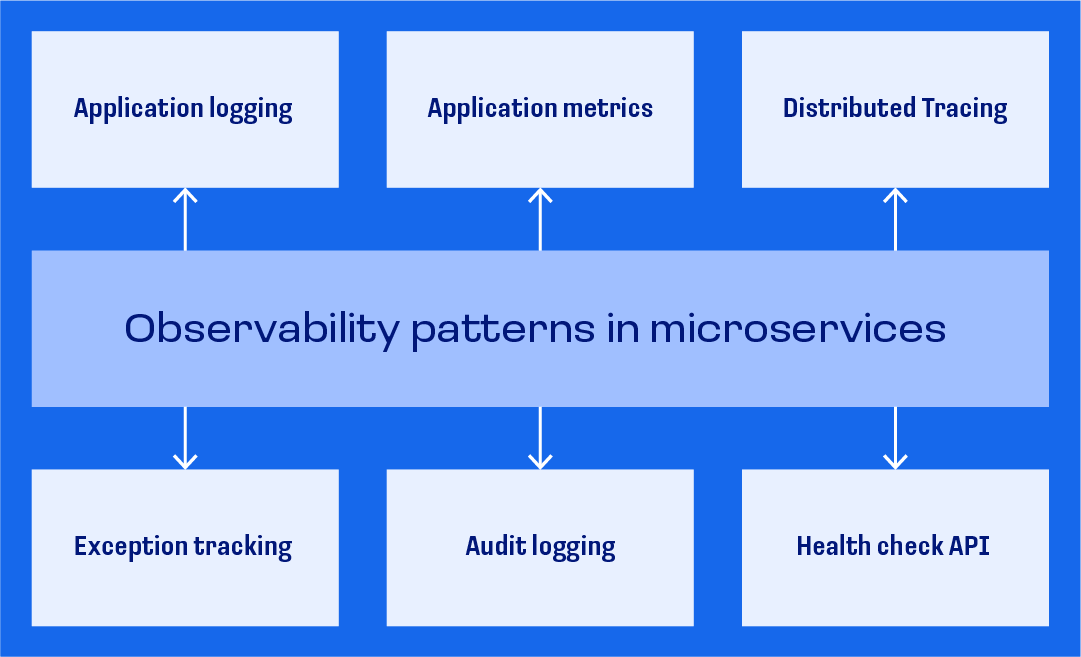
Instrumentation
Instrumentation is a crucial step to establish observability. It identifies how you want to observe the internals of the application, and which events you want to measure to understand what the code is doing when it’s responding to a particular request.
- Use data points around your code to construct a useful telemetry dataset, which can be queried on demand. A strong observability practice demands proper instrumentation in place to aggregate telemetry data about systems.
- To simplify the collection of telemetry data (metrics, logs, and traces) you should adopt instrumentation libraries like OpenTelemetry, Micrometer, etc. They assist in instrumenting code to remove vendor lock-in. This enables a wider set of options for teams to use when analyzing their logs, metrics, and traces.
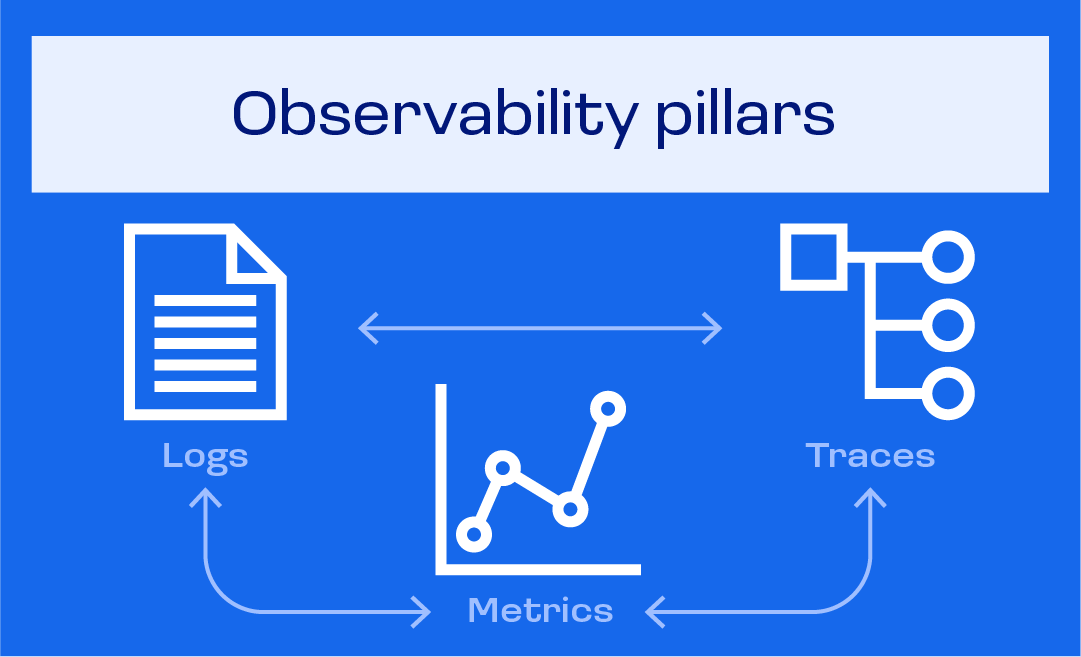
Metrics, logs, and traces
The foundations of observability revolve around metrics, logs, and traces. Aggregation and correlation of metrics, logs, and traces at a centralized location is crucial for establishing successful observability process.
Metrics
Metrics are a numeric representation of data measured over time intervals. Examples of metrics can be CPU usage, memory utilization, network traffic, response times, containers health, error rates, latencies, etc.
- Define the metrics that are most important; they might range from infrastructure to application services.
- Associate the metrics with thresholds and SLOs to make them actionable.
Logs
Logs are immutable timestamped events and errors that happened over time within a system.
- Establish an agreed logging pattern with a structured format like JSON or XML; this makes it easier to query log data.
- Use logs as a powerful tool during troubleshooting.
- Logs should carry enough context and sequence to permit analysis of the sequence of events that lead to certain behavior within a system.
- Index logs for querying and analytics.
Events
Events represent a unit of work and contain all of the information necessary for a service to complete a particular task. Events may not be similar to structured logs. Usually, a group of logs can constitute a single event. Events are mainly useful to gain product and user experience insights.
Traces
Traces follow the path of a particular request as it moves through different systems to provide insights into a transaction flow. Traces, like metrics, are more useful after you add context to them.
Visualization dashboards
After you have telemetry data flowing in, you should add visual representations of this data to easily view important data points.
- Use data visualization tools and dashboards to present monitoring data easily and understandably.
- Use queries with your dataset to create clear and intuitive dashboards. This helps teams and stakeholders identify trends, anomalies, and performance bottlenecks.
Application performance monitoring (APM) tools can help you aggregate data into charts and graphs to see meaningful representations of your data.
Alerts and thresholds
The process of setting up alert policies is an essential step in ensuring effective observability. Observability tools provide convenient means to easily create alert policies based on various metrics. If a specific metric surpasses a predefined threshold, the system will promptly trigger alerts. These alerts can be seamlessly integrated with notification systems or in-call alerting tools.
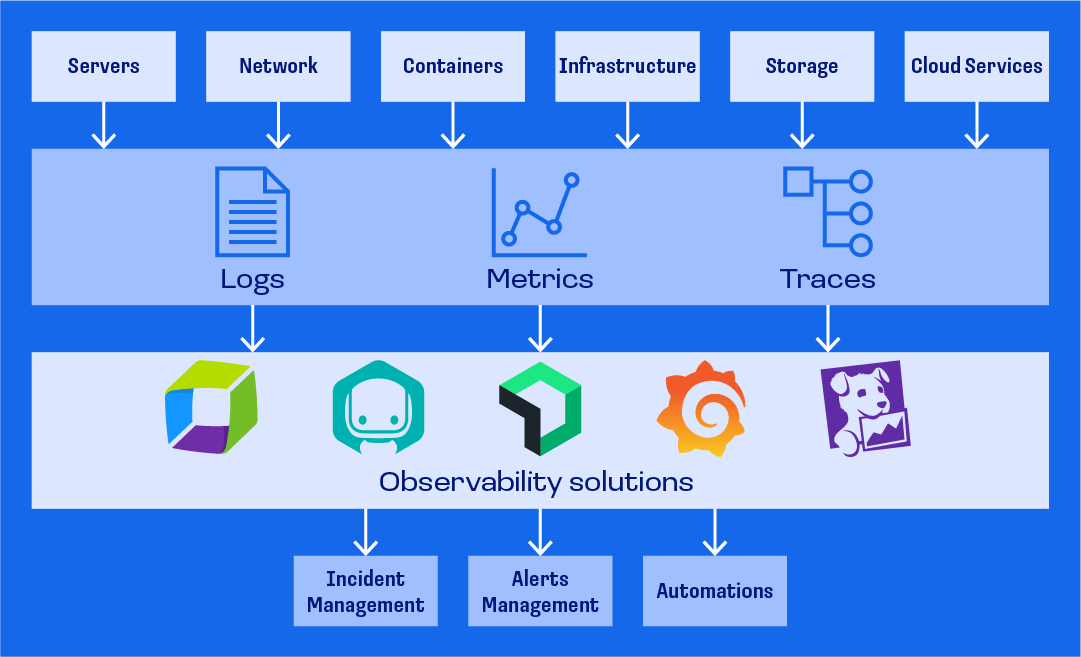
Observability and monitoring tools
Observability solutions help users associate infrastructure components with application components, understand the integration of all services, and detect anomalies in behavior.
Consider using the following tools:
Conclusion
Monitoring and observability play a crucial role in ensuring the seamless operation of modern software systems, which typically consist of microservices, containers, and cloud or multicloud application environments. When companies adhere to industry best practices, adopt established standards, and promote a culture of observability, they can ensure that their systems operate reliably and at peak performance.
The views expressed in the articles on this site are solely those of the authors and do not necessarily reflect the opinions or views of Anywhere Club or its members.

.png?auto=webp)
